


Sectoral emissions
For both, inventory if greenhouse gases and air pollutants, more than 100 source categories need to be reported. The large number of categories makes it necessary to group these sources into 4 main sectors: energy, industrial processes and product uses, agriculture and waste. Each of sub-categories of these sectors and their further breakdowns include well-defined activities. An additional sector, the fifth sector, forest and land use, is included only in the GHG inventory.
More detailed information on the emissions of each sector can be found in the Sectoral Emissions sub-menu by clicking on the corresponding sectors in the links above. In brief, the following activities belong to the 4+1 main sectors:
- Energy: energy production (fuels/waste), fuel transformations, transport, fuel mining, fuel production, fuel treatment, leaks during transport
- Industrial processes and product use: production of mineral/ chemical/ metal/ paper and paper products, food and beverage production, other product uses
- Agriculture: livestock, manure management, cultivation of agricultural soils
- Waste: solid waste landfilling, waste and waste water treatment, waste incineration
- Land use and forestry: forests, agricultural and wetland areas, settlements, wood products
Graph below shows the sectoral share of 2019 emissions by air pollutant. Of the total national emissions, CO, BC, PM2.5 particulate matter and SOx account for a dominant share of the energy sector. For NMVOC, TSP and PM10, industry (and also agriculture) is already a significant source of emissions. For ammonia, however, energy is responsible for only 6%, agriculture being the leading source (92%). Emissions of NMVOC, PM10 and TSP are more evenly distributed.
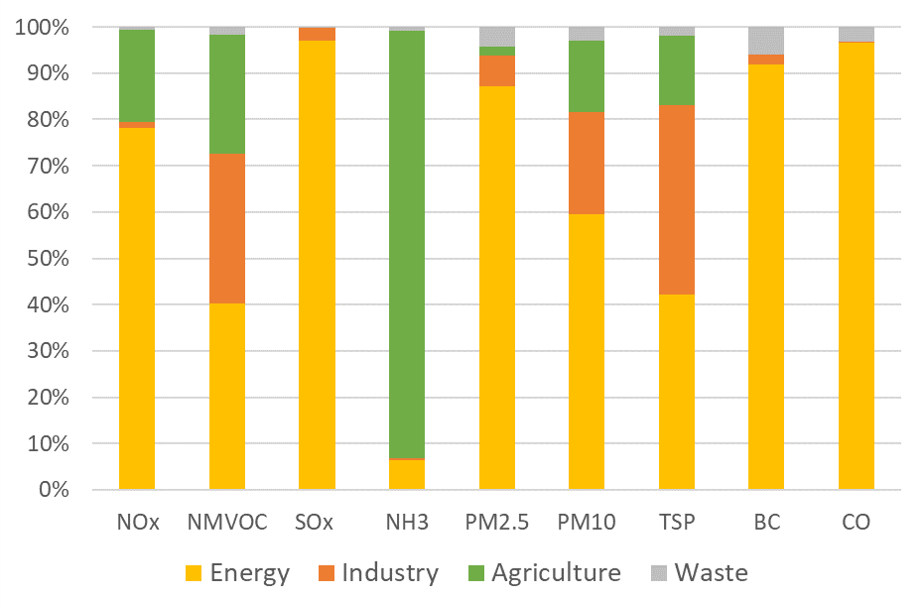
Figure 1. Rate of national total emissions by subcategory for the main pollutants in 2019 (%)
By far, the biggest emitting sector was the energy sector contributing 72% to the total GHG emission in 2019. Industrial processes and product use (IPPU) was the second and agriculture was the third largest sector with 12% and 11%, respectively. The waste sector contributed 5%. Compared to the base year, emissions were significantly reduced in the energy (-42%), IPPU (-49%), and agriculture (-41%). In contrast, emissions in the waste sector have increased slightly since 1985 (+7%). The land use, land-use change and forestry (LULUCF) sector shows fluctuating behavior. Looking at the more recent trends since 2005, emissions have significantly decreased in the energy and industrial processes sectors by 19% and 15%, respectively. The agriculture sector seems to have recovered and could show an increase of 16% since 2005. The previous growing trend turned back in the waste sector (-18%).
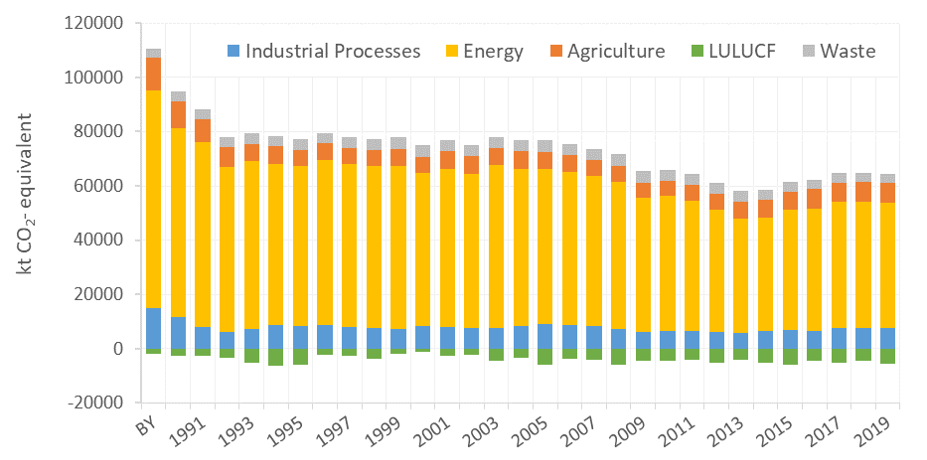
Figure 2. Trends of GHG emission between base year and 2019, by sectors