Greenhouse effect gases
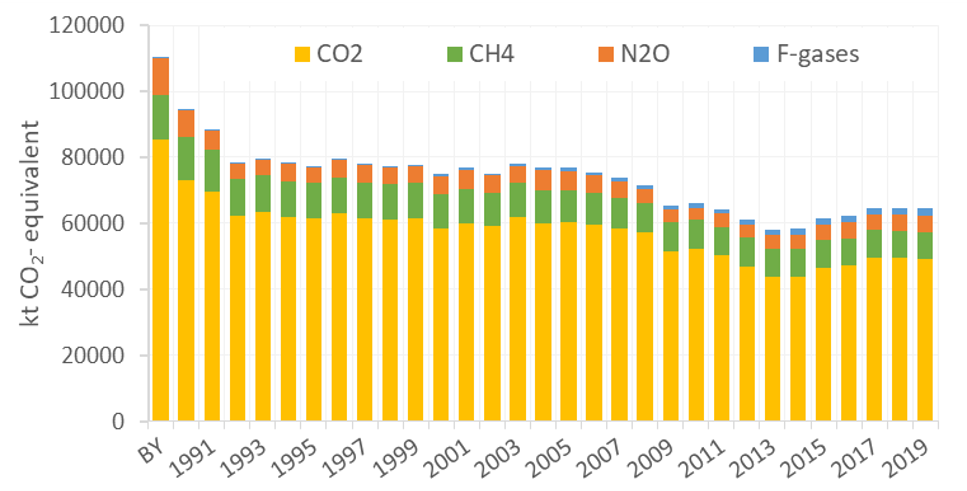
In 2019, total emissions of greenhouse gases in Hungary were 64.4 million tonnes carbon dioxide equivalents (CO2-eq) excluding the LULUCF sector. Emission totals did not change significantly in the last three years (2017-19), thus the growing trend after 2013 seems to have stopped. Taking into account also the mostly carbon absorbing processes in the LULUCF sector, the net emissions of Hungary were 58.8 million tonnes CO2-eq in 2019. Being about 6 tonnes, the Hungarian per capita emissions are below the European average.
Compared to the base year (average of 1985-87), 1990, and 2005, our current emissions are lower by 42%, 32%, and 16%, respectively.
This significant reduction was partly a consequence of the regime change in Hungary (1989-90) which brought in its train radical decline in the output of the national economy. The production decreased in almost every economic sector including also the GHG relevant sectors like energy, industry and agriculture. Then, between 2005 and 2013, after a period of about 14 years of relatively stagnant emission level (1992-2005), GHG emissions fell again quite significantly by 24 per cent. The global financial and economic crisis exerted a major impact on the output of the Hungarian economy, consequently on the level of GHG emissions as well resulting in a quite significant drop of 9% between 2008 and 2009. Then, after a smaller increase in 2010, emissions decreased further in the following four years. In contrast, the decline in economic output stopped in the first quarter of 2010, and Hungary not only reached the pre-crisis level of GDP again in 2014 but exceeded it even in 2015.
After 2013, emissions started growing again. Up to 2017, the overall increase reached 11%. However, the level of total emissions has stabilized since then.

Figure 1. GHG emission trends between base year and 2019, by gas
The most important greenhouse gas is carbon dioxide accounting for 76% of total GHG emissions. The main source of CO2 emissions is burning of fossil fuels for energy purposes, including transport. CO2 emissions have decreased by 43% since the middle of the 80’s. Methane represents 13% in the GHG inventory. Methane is generated mainly at waste disposal sites and in animal farms, but the fugitive emissions of natural gas systems (i.e. transmission, storage, and distribution) are also important sources.
CH4 emissions are by 39% lower than in the base year.
N2O contributes 8% to the total GHG emissions. Its main sources are agricultural soils, and manure management. N2O emissions are 56% lower compared to base year.
The total emissions of F-gases amount to 3%. Use of ozone-friendly HFCs in refrigeration and air-conditioning systems and the use of SF6 gas as an insulating and quenching medium in electrical switchgear still merit attention, due to the growth in the early 2000s.
For more information on sectoral emissions go to Sectoral emissions.


