


Waste
The most important air pollutants relating to the waste sector are dioxins and furans (the waste sector accounted for 16% of total emissions in 2019), mercury (7%), zinc (7%), arsenic (5%), and particulate matter (PM2.5 3% and PM10 4%, BC 6%). The figure below shows the emissions of major air pollutants as a percentage of total national emissions.
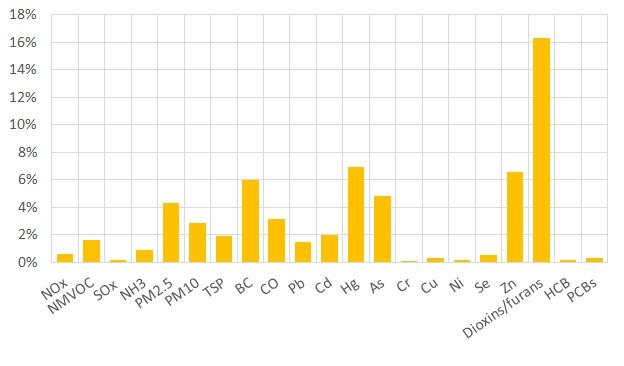
Figure 1. Air pollutants emitted in the waste sector as a percentage of total national emission
Within the waste sector emissions are distributed differently between subsectors. The below figure shows the air pollutants where more than 1% of the total national emissions come from the waste sector.
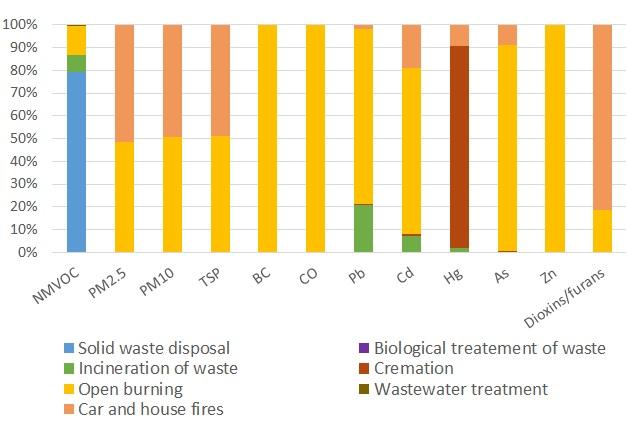
Figure 2. Air pollutant emissions from the waste sector by pollutants and subsectors
In case of managed waste disposal, waste is disposed in landfills where it is compacted and covered. Under these circumstances anaerobic degradation occurs during which mostly methane and carbon dioxide is emitted. Landfills also emit non-methane volatile organic compounds (NMVOCs). NMVOC emissions are calculated on the basis of methane emissions. Emissions have a decreasing trend as the amount of waste landfilled has been significantly decreasing since 2005.
Waste incineration subsector covers only emissions from thermal waste treatment without energy recovery (mainly hazardous waste incineration). Emissions from waste incineration for energy purposes are allocated to the energy sector. Waste incineration in a closed combustion chamber mainly generates NMVOC, lead, cadmium and mercury emissions.
Open burning of waste category includes the open-air incineration of garden waste, orchard and vine pruning and slash from forestry operations. The incineration of garden waste has been banned in many settlements in the recent years. Due to the rules and regulations of the EU subsidies and the domestic law incineration of pruning has also a decreasing trend. The practice of slash burning has not changed significantly in the last decade. Open burning is a source of particulate matter emissions as well as emissions of carbon monoxide, lead, cadmium, arsenic, zinc, dioxin and furan. The figure below shows the trend of particulate matter emissions (PM10) from open burning and the amount of waste open burned between 1985 and 2019.
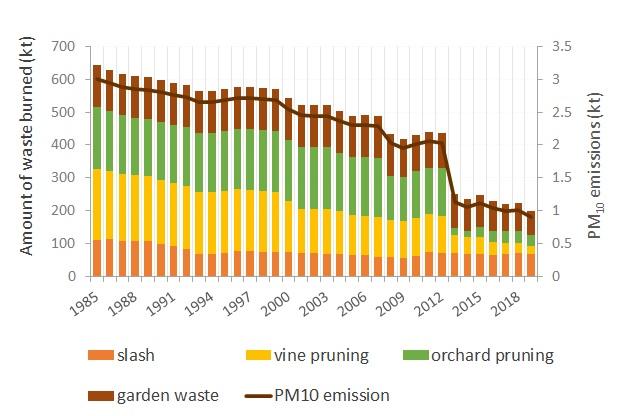
Figure 3. PM10 emissions from open burning of waste
Emissions from cremation of dead bodies and from car and house fires are also accounted for in the waste sector. Cremation is source of mercury emissions. Car and house fires lead to dioxin and furan, cadmium, mercury, arsenic, lead, and particulate matter emissions.
Air pollutant emissions from biological treatment of solid waste and wastewater treatment and discharge are not significant.
This section discusses the emissions from solid waste disposal (CH4), biological treatment of solid waste including composting and anaerobic digestion at biogas facilities (CH4, N2O), waste incineration (CO2, CH4, and N2O), and domestic and industrial wastewater treatment (CH4 and N2O). One peculiarity of the sector is that most part of the carbon-dioxide emissions is generated from biological (biogenic) sources and this CO2 emissions are either reported as carbon stock change in the Land Use sector or do not need to be accounted for.
The waste sector with 3,436.7 Gg CO2 equivalent represented 5% of total national GHG emissions in 2019. The largest category was solid waste disposal on land, representing 85% in 2019, followed by wastewater treatment and discharge (9%), biological treatment of solid waste (5%), and incineration of waste without energy recovery (1%). In contrast with other sectors, emissions from the waste sector are slightly higher now than in the base year. However, the growth in emissions stopped in the last decade, and a reduction of 18% could be observed between 2005 and 2019.
The trend of emissions of the different categories in waste sector is summarized in the below figure.
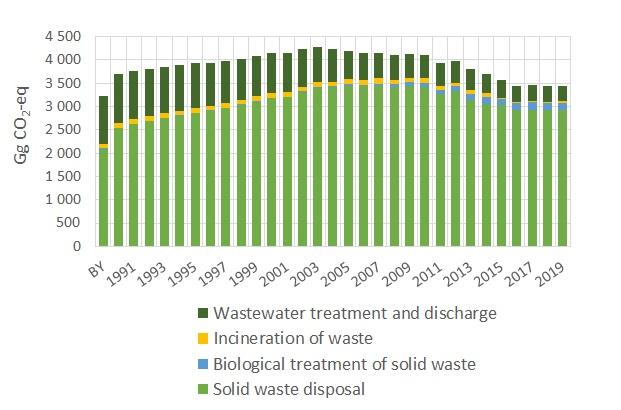
Figure 1. Emissions from the waste sector
A major but decreasing part of municipal solid wastes (MSW) is treated by managed disposal and a smaller part by reuse, incineration or other means. The average specific municipal household waste generation rate decreased from 1.3 to 1.0 kg/capita/day in the last few years. The total amount of MSW was 3,791 Gg in 2019. Out of this 36% was recovered by recycling and composting, 14% was incinerated for energy purposes, and 51% went to landfills.
Main trends in municipal waste handling are shown in the figure below.
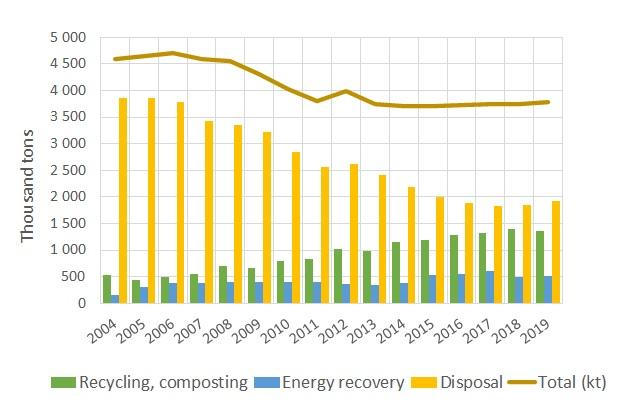
Figure 2. Main trends in municipal waste handling
The degradation process in solid waste disposal sites is quite slow which means that waste that were disposed many years earlier have still an influence on current emission levels. However, the amount of disposed waste had dropped significantly since 2005 (e.g. landfilled municipal waste decreased by 50%) consequently methane emissions started to decrease as well.
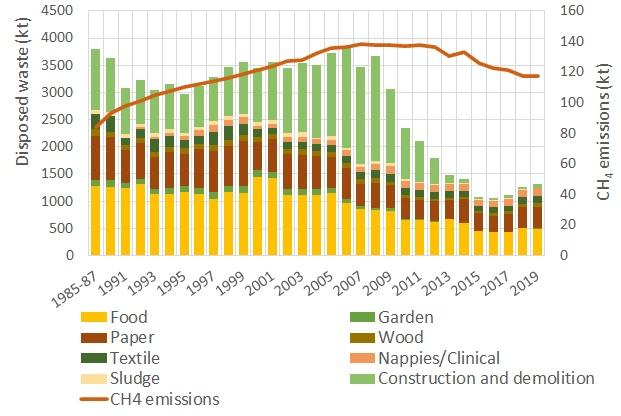
Figure 3. Amount of disposed waste and the resulting methane emissions
GHG emissions from wastewater handling have a pronounced decreasing trend due to a growing number of dwellings connected to the public sewerage network. These trends are shown in the figure below.
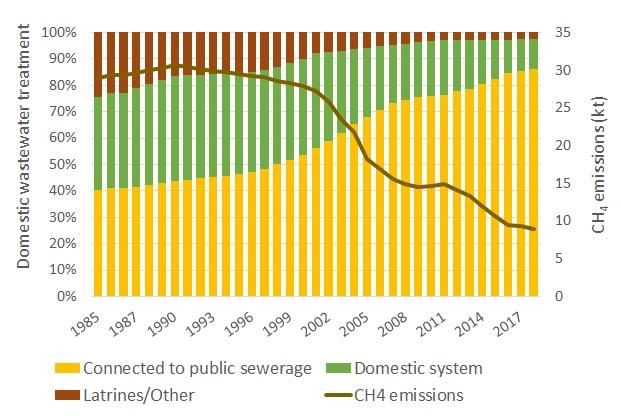
Figure 4. Domestic wastewater treatment and the resulting methane emissions
As tertiary treatment became the dominant technology in wastewater treatment N2O emissions also show a decreasing trend.
Biological treatment of solid waste (including composting and anaerobic digestion at biogas facilities) is a source of methane and N2O emissions.
Waste incineration subsector covers only emissions from thermal waste treatment without energy recovery (mainly hazardous waste incineration). Emissions from waste incineration for energy purposes are allocated to the energy sector. During waste incineration, mainly CO2 is emitted out of which only the fossil part contributes to the total emissions. Methane emissions are insignificant and N2O generation is also minimal.